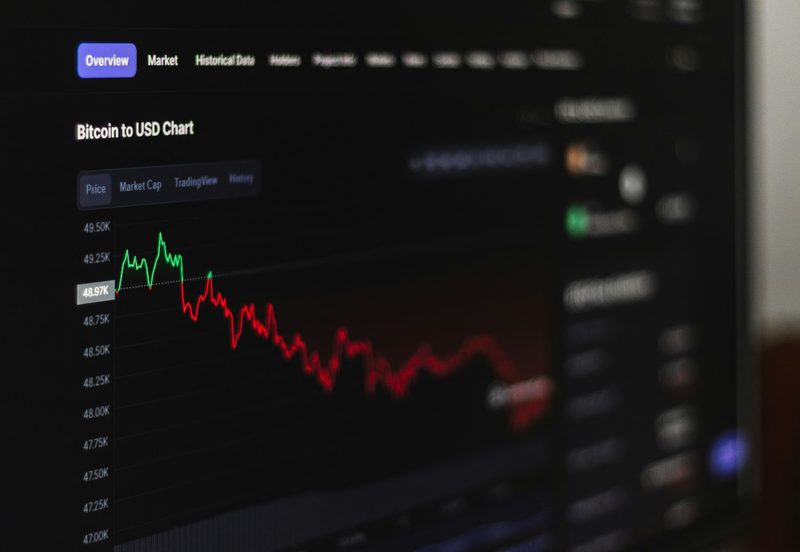
Accumulation is the phase of the Wyckoff cycle where the real work is done in secret. While the public stares at a boring, sideways range and loses interest, the Composite Man is quietly buying — absorbing the supply offered by discouraged sellers at low prices, building a large position without driving the price up and revealing his hand. When accumulation is complete, the markup begins, and those who read the range correctly are already positioned. This guide breaks down the accumulation schematic: the phases and the specific events that let a trader recognise accumulation as it happens, rather than only in hindsight.
This is a detailed look at one half of the cycle introduced in the Wyckoff Method explained; its mirror image is covered in Wyckoff distribution.
Key takeaways
Q: What is Wyckoff accumulation?
A: Wyckoff accumulation is the sideways trading range in which large operators quietly buy from a discouraged public at low prices, before a markup (uptrend) begins. It unfolds through a recognisable schematic of phases and events that signal the transition from selling to buying.
Q: What are the phases of Wyckoff accumulation?
A: Accumulation unfolds through five phases: Phase A (stopping the prior downtrend), Phase B (building the cause through ranging), Phase C (the test, often a spring), Phase D (signs of strength and the start of markup within the range), and Phase E (the trend leaving the range).
Q: What is a spring in Wyckoff accumulation?
A: A spring is a brief dip below the support of the accumulation range that quickly reverses back inside. It shakes out remaining sellers and triggers stops, allowing operators to absorb the last supply before markup. It often marks the final low.
The accumulation schematic
Wyckoff mapped accumulation into a repeatable schematic — an idealised diagram of how the range unfolds, bounded by a support level (the floor) and a resistance level (the ceiling). Within those boundaries, price traces a sequence of recognisable events as the balance shifts from selling to buying. Real markets never match the textbook diagram exactly, but the schematic gives the trader a map: a set of landmarks to look for and an order in which to expect them.

The value of the schematic is that it turns a featureless-looking range into a readable story. Each event has meaning, and the sequence of events tells you how far along the accumulation process has progressed — and therefore how close the markup may be. Learning to identify the events in order is the core skill of trading accumulation.
The key events
Accumulation proceeds through a series of named events, each marking a step in the Composite Man's campaign:
- Preliminary Support (PS) — the first significant buying that begins to slow the prior downtrend, hinting that demand is starting to appear.
- Selling Climax (SC) — a sharp, high-volume sell-off as panic peaks. This is where the public capitulates and the Composite Man absorbs enormous supply. It often marks the low of the entire range.
- Automatic Rally (AR) — the bounce that follows the climax once selling exhausts itself, defining the upper boundary of the range.
- Secondary Test (ST) — price returns toward the climax low to test whether selling pressure has truly dried up. A successful test holds above the low on lighter volume.
- Spring (or Shakeout) — a dip below support that quickly reverses, shaking out the last sellers and triggering stops before markup.
- Sign of Strength (SOS) — a strong rally, often breaking above the range's resistance on rising volume, confirming demand is now in control.
- Last Point of Support (LPS) — a higher low on the pullback after the sign of strength, the final low-risk entry before the markup accelerates.
Not every accumulation contains every event, and they do not always appear in textbook order — but this vocabulary lets a trader narrate what is happening and anticipate what comes next.
The five phases
Wyckoff organised these events into five phases, labelled A through E, which describe the overall progression of the range. Phase A stops the prior downtrend: the preliminary support, selling climax and automatic rally appear here, halting the decline and establishing the range's boundaries. Phase B is the longest, where the Composite Man "builds the cause" — accumulating his position through repeated tests and swings within the range while the public loses interest. This is the patient, position-building heart of accumulation.
Phase C is the test, and it is where the decisive action often occurs: the spring, where price dips below support to shake out the final sellers before reversing. Phase D is where the evidence of demand becomes clear: the sign of strength and the last point of support appear, and price begins to mark up within and then beyond the range. Finally, Phase E is the markup proper, as price leaves the range and the uptrend gets underway. Reading which phase you are in tells you how mature the accumulation is and how imminent the trend may be.
Phase B is where patience is tested and the cause is built; Phase C's spring is where the opportunity crystallises. The trader who recognises a successful spring in Phase C, confirmed by a sign of strength in Phase D, can enter before the markup that most traders only notice once it is well underway.
The spring as a liquidity grab
The spring deserves special attention because it connects Wyckoff directly to modern trading. A spring is a deliberate-looking dip below the obvious support of the range, just far enough to trigger the stop-loss orders resting below it, followed by a swift reversal back into the range. In Wyckoff's framing, this shakes out the last weak holders and lets the Composite Man absorb their supply at the lowest prices before markup.
If that sounds familiar, it should: it is precisely what Smart Money Concepts calls a liquidity sweep. The stops resting below an obvious support level are sell-side liquidity, and the spring is the move that collects them before the real direction asserts itself. Wyckoff described this mechanism a century before SMC gave it new vocabulary, and recognising the two as the same phenomenon is genuinely useful — it means the deep, careful literature on Wyckoff springs applies directly to trading what SMC calls liquidity grabs. The spring is explored further in springs and upthrusts.
Trading accumulation on forex
For the forex trader, accumulation analysis offers a structured way to anticipate the start of a trend rather than chase it. The practical approach is to identify a sideways range after an extended decline, watch for the sequence of events — a climactic low, an automatic rally, secondary tests — and pay particular attention to a spring in Phase C followed by a sign of strength. An entry on the last point of support, with a stop below the spring low, offers the favourable risk-to-reward that comes from positioning early in a new trend.
The honest caveat returns here: Wyckoff's confirmations lean heavily on volume, and on spot forex only tick volume is available as a proxy. The price-structure side of the schematic — the sequence of events and the spring — translates well to currencies, but the volume confirmations are less reliable than on centralised markets. Treating the structure as primary and tick volume as supporting evidence, rather than gospel, is the sensible adaptation. Read that way, and always with a defined invalidation, accumulation analysis gives the forex trader a powerful map of where the next trend is likely to begin.
Reaccumulation versus accumulation
One of the trickiest situations in Wyckoff analysis is the range that forms during an uptrend rather than at its bottom. This is reaccumulation: a pause in which the Composite Man accumulates additional position before driving price higher, rather than initiating a brand-new campaign from a low. Structurally, a reaccumulation range looks much like an ordinary accumulation range — the same support and resistance boundaries, the same events — but it occurs partway up a trend, as consolidation before continuation.
The challenge is that a range forming after a substantial advance is genuinely ambiguous in real time: it could be reaccumulation (a pause before more upside) or distribution (a top before a reversal). The two can look nearly identical while they are forming, which is precisely why distribution is so dangerous. The clues that favour reaccumulation are contextual: the range holds above prior support, springs are quickly and strongly reversed, signs of strength appear on good volume, and the broader trend structure remains intact. Clues that favour distribution are the opposite — failing upthrusts, weak rallies, and signs of weakness breaking support.
The honest reality is that even skilled Wyckoff analysts cannot always distinguish the two until the range resolves, and pretending otherwise is a mistake. The practical defence is to trade the resolution rather than the prediction: wait for the range to break and confirm its direction with a sign of strength or weakness before committing, rather than assuming a mid-trend range must be a continuation. Holding that humility — accepting that a range is ambiguous until it proves itself — is what separates disciplined Wyckoff trading from wishful pattern-fitting.
Wyckoff accumulation is the range where operators quietly buy before markup, unfolding through events (PS, SC, AR, ST, spring, SOS, LPS) across five phases (A stops the downtrend, B builds the cause, C tests with the spring, D shows strength, E marks up). A similar range mid-trend is reaccumulation — often indistinguishable from distribution until it resolves, so trade the confirmed break, not the guess. The spring is a liquidity grab by another name.