A price chart looks like meaningless noise until you know how to read it — and then it becomes the single most useful picture in trading. Learn the axes, the timeframes, and how to read a candlestick, and the chart transforms into a clear story of where price has been, what it's doing now, and where the key levels lie. Reading a chart is the foundation of technical analysis and, more basically, of simply understanding what you're looking at when you open a trading platform. This guide covers the essentials: the axes, timeframes, the main chart types, how to read a candlestick, and what to look for on the chart.
It's distinct from reading the price numbers (covered in how to read a forex quote), leads into support and resistance and market structure, and is the entry point to the whole of technical analysis.
Key takeaways
Q: How do you read a forex price chart?
A: Start with the axes: time runs along the horizontal axis (left is past, right is now) and price up the vertical axis. Each bar or candle represents one period of the chosen timeframe. Then read the price action — the trend (up, down or sideways), support and resistance levels, and how price is behaving. The chart is a visual record of price over time.
Q: What is the difference between line, bar and candlestick charts?
A: A line chart connects closing prices — simple and clean but minimal detail. A bar chart shows the open, high, low and close of each period. A candlestick chart shows the same data with a coloured 'body' (open to close) and 'wicks' (the high and low), making price action easy to read at a glance — which is why it's the most popular type.
Q: How do you read a candlestick?
A: A candlestick's body shows the range between the open and close: typically green (or hollow) if price closed above where it opened (up), red (or filled) if it closed below (down). The thin wicks above and below the body show the highest and lowest prices reached during the period. So one candle conveys open, high, low and close at a glance.

The axes and timeframes
Every price chart shares the same basic structure: two axes. The horizontal axis is time — moving from the past (left) to the present (right) — and the vertical axis is price — higher up the chart means a higher price, lower down means a lower price. So a chart simply plots price over time: as you read left to right, you're moving forward in time, and as the plotted price moves up or down, you're seeing the currency pair's price rise or fall. This is the fundamental thing a chart shows — the history of price, leading up to the current moment on the right-hand edge. Once you internalise "right is now, up is higher price," the chart starts to make sense.
The second key concept is the timeframe. Every chart is set to a timeframe — 1-minute, 5-minute, 1-hour, 4-hour, daily, weekly, and so on — which determines what each bar or candle on the chart represents. On a 1-hour chart, each candle represents one hour of price action; on a daily chart, each candle is one day. The timeframe you choose dramatically changes what you see: lower timeframes (1-minute, 5-minute) show fine detail but more "noise" (lots of small, often random-looking movement), while higher timeframes (daily, weekly) show the bigger picture and the major trends, smoothing out the noise. Which timeframe to use depends on your trading style — a scalper watches minutes, a swing trader watches hours and days, a position trader watches weeks. Beginners often benefit from starting on higher timeframes (clearer, less frantic) before dropping to lower ones. The key point is to know which timeframe you're looking at, since the same pair can look very different across timeframes.
Chart types and reading a candlestick
There are three main chart types, differing in how much information each shows. The table compares them.
Line vs bar vs candlestick
| Type | Shows | Best for |
|---|---|---|
| Line | Closing prices only | Simplest — clean view of the trend |
| Bar (OHLC) | Open, high, low, close | Full detail, compact |
| Candlestick | Open, high, low, close — visually | Most popular — clear price action |
The line chart simply connects the closing prices of each period into a single line — it's the simplest, giving a clean view of the overall trend, but it shows the least detail (only closes, not the highs, lows or opens). The bar chart (or OHLC chart) shows, for each period, the Open, High, Low and Close as a small vertical bar with ticks — more detailed than a line. The candlestick chart shows the same OHLC data but in a more visual, readable form, which is why it's by far the most popular chart type among traders and the one you'll most often use.
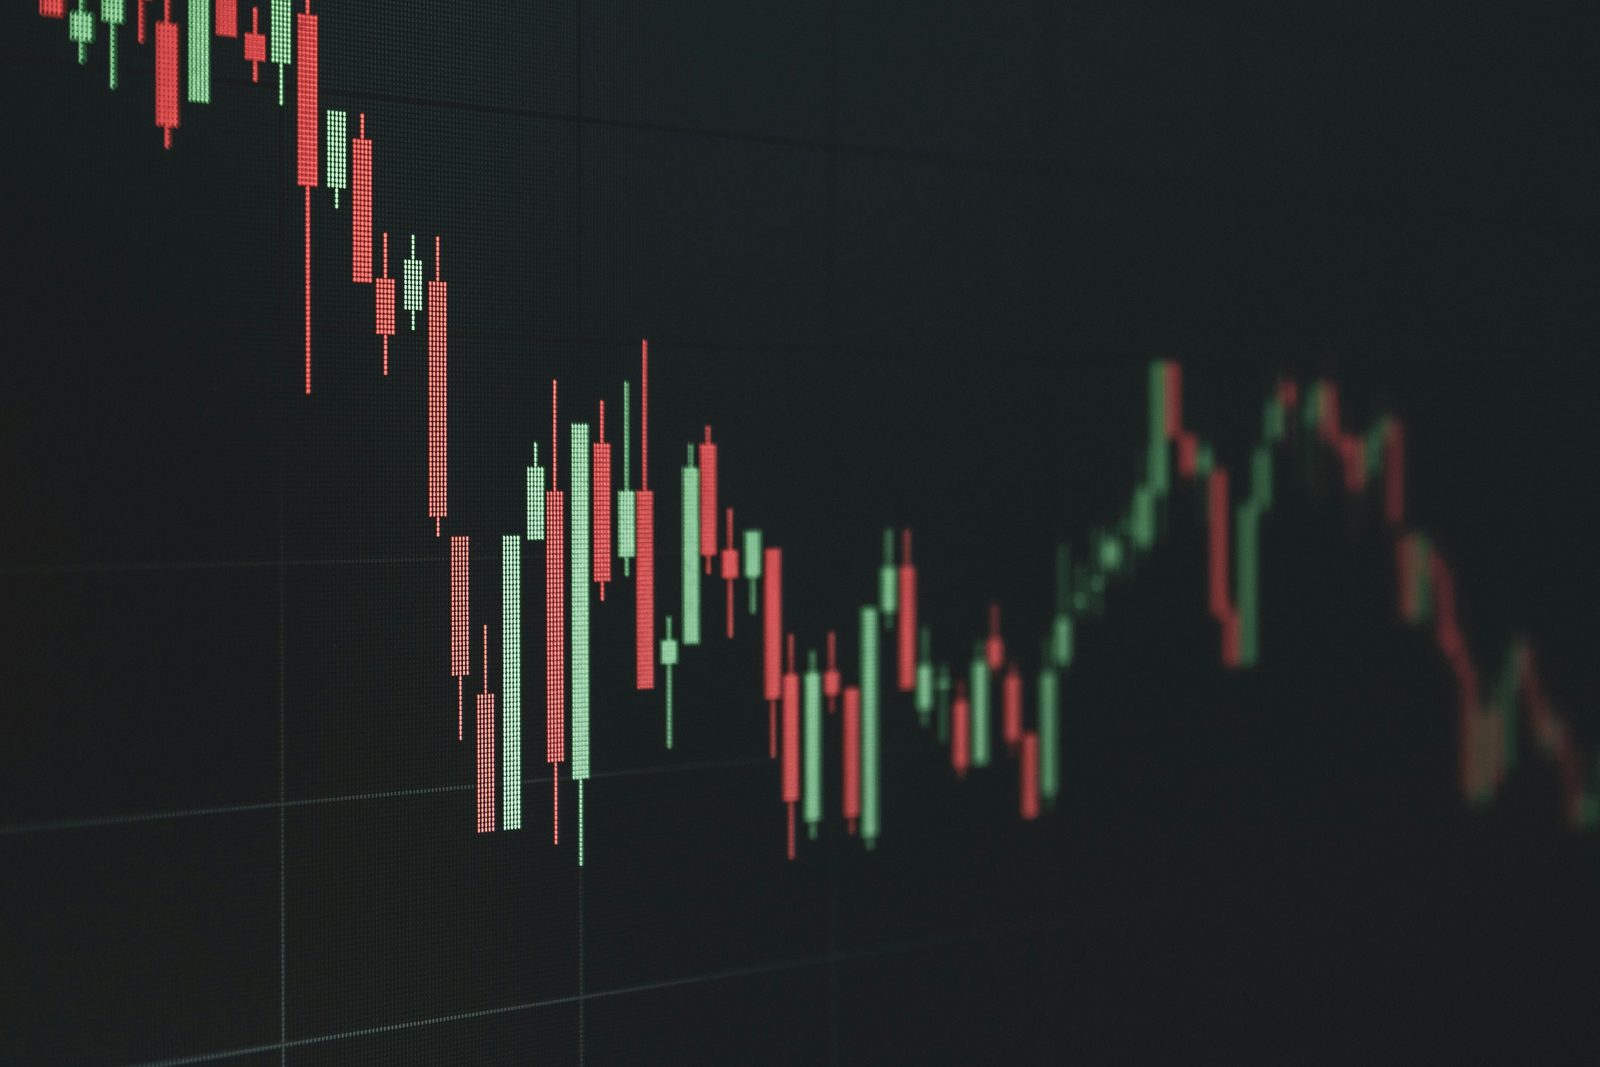
Reading a candlestick is a core skill, and it's straightforward once explained. Each candle has a body and wicks (also called shadows). The body represents the range between the open and the close for that period, and its colour tells you the direction: conventionally, green (or hollow) means price closed above where it opened — an "up" period — while red (or filled) means price closed below where it opened — a "down" period. The thin wicks extending above and below the body show the highest and lowest prices reached during the period. So a single candlestick conveys, at a glance, all four data points — where price opened, closed, and the high and low it reached — along with the direction (via colour) and the strength of the move (via the size of the body and wicks). This visual richness is exactly why candlesticks are so widely used, and why they form the basis of candlestick patterns — recognisable single- or multi-candle shapes (like the doji or engulfing patterns) that traders read for clues about price behaviour. For now, the key skill is reading the individual candle: body = open-to-close, colour = direction, wicks = the high and low.
What to look for on the chart
Once you can read the axes, timeframe and candles, the next level is reading the price action — the story the chart is telling. A few basics anchor this. First, the trend: is price generally moving up (an uptrend), down (a downtrend), or sideways (ranging)? Trend is often described by the pattern of highs and lows — an uptrend makes higher highs and higher lows, a downtrend lower highs and lower lows — which is the basis of reading market structure and the trend (the trend material). Identifying the trend is foundational, since trading with the trend is generally easier than against it.
Second, support and resistance: levels where price has repeatedly stalled or reversed — support below (where price tends to stop falling) and resistance above (where it tends to stop rising). These key levels are among the most useful things to spot on a chart, marking where price may react. Third, the general price action: how price is behaving — strong directional moves versus choppy indecision, where the recent highs and lows are, how price is moving relative to the levels and trend. Reading these elements turns the chart from a wall of candles into meaningful information about the market. The honest framing: reading a price chart is the basic visual skill underpinning all technical analysis — understand the axes (time horizontal, price vertical), the timeframe (what each candle represents), and the chart types (candlesticks being the most useful), then learn to read a candle (body, colour, wicks) and the price action (trend, support/resistance, behaviour). It's the foundation; from here you build into indicators, patterns and the rest of technical analysis. The best way to develop the skill is simply to practise — spend time looking at charts, identifying the trend and the levels, reading the candles — until reading a chart becomes second nature. It's a skill that rewards screen time, and it's well worth building early.
Using more than one timeframe
Once you're comfortable reading a single chart, a powerful next habit is looking at more than one timeframe for the same pair — because the same market can tell a different story depending on the timeframe, and combining them gives a fuller picture. The common approach, often called top-down analysis, is to start on a higher timeframe (say the daily or 4-hour) to understand the bigger picture — the major trend, the significant support and resistance levels, the broad context — and then drop to a lower timeframe (say the 1-hour or 15-minute) to read the finer detail and time a more precise entry. The higher timeframe tells you the overall direction and the key levels; the lower timeframe helps you act within that context. This guards against a classic beginner error: trading purely off a low timeframe and missing that the bigger picture is pointing the other way.
A simple illustration: if the daily chart shows a clear uptrend and price has pulled back to a daily support level, that's a high-level context suggesting you might look for buying opportunities; you'd then switch to a lower timeframe to find a precise entry as price shows signs of resuming higher. The higher timeframe sets the bias; the lower one refines the timing. The key discipline is to let the higher timeframe carry more weight for direction — a signal on a 5-minute chart means little if it fights a strong daily trend. Beyond multiple timeframes, the broader skill that develops with practice is reading price action — interpreting how price is behaving (strong directional candles versus indecisive ones, how it reacts at levels, whether it's trending or choppy) to sense what the market is doing. This is something that genuinely improves with screen time: the more charts you read, identifying the trend, the levels and the behaviour across timeframes, the more naturally the chart's story reveals itself. Start with a single chart, master reading it, then add the multi-timeframe perspective — and keep practising. The chart rewards the time you put into reading it.
A price chart plots price over time: the horizontal axis is time (left = past, right = now), the vertical axis is price. The timeframe sets what each bar/candle represents (1-minute to weekly); lower timeframes show detail and noise, higher ones show the big picture. Three chart types: line (closing prices — simplest), bar (open/high/low/close), and candlestick (OHLC shown visually — the most popular). Read a candlestick by its body (the open-to-close range; green = closed up, red = closed down) and its wicks (the high and low reached). Then read the price action: the trend (up/down/sideways, via higher/lower highs and lows), support and resistance levels, and how price is behaving. It's the foundation of technical analysis — practise reading charts until it's second nature.